Using Shipping Controls

According to recent ONS figures, over 30% of businesses in the UK experienced difficulties getting the stock they needed during 2021, as supply chain issues continue to bite. Ensuring goods and materials arrive on time, in the right place, has become an important part of maintaining productivity.

SQLWorks offers a range of optional shipping controls that can help businesses better manage challenging supply chains, including:


Consolidations

Consolidations allow a purchasing manager to group individual purchase orders together into a consolidated group (for example representing the contents of a single shipping container) and assign meta-data to that consolidation, such as freight vessel numbers, suppliers, delivery details, docking dates and more.

Each new consolidation can be managed from the Purchase Ledger – simply select the purchase orders that need to be grouped and move them across the screen from left to right to assign them to the container.

consolidations

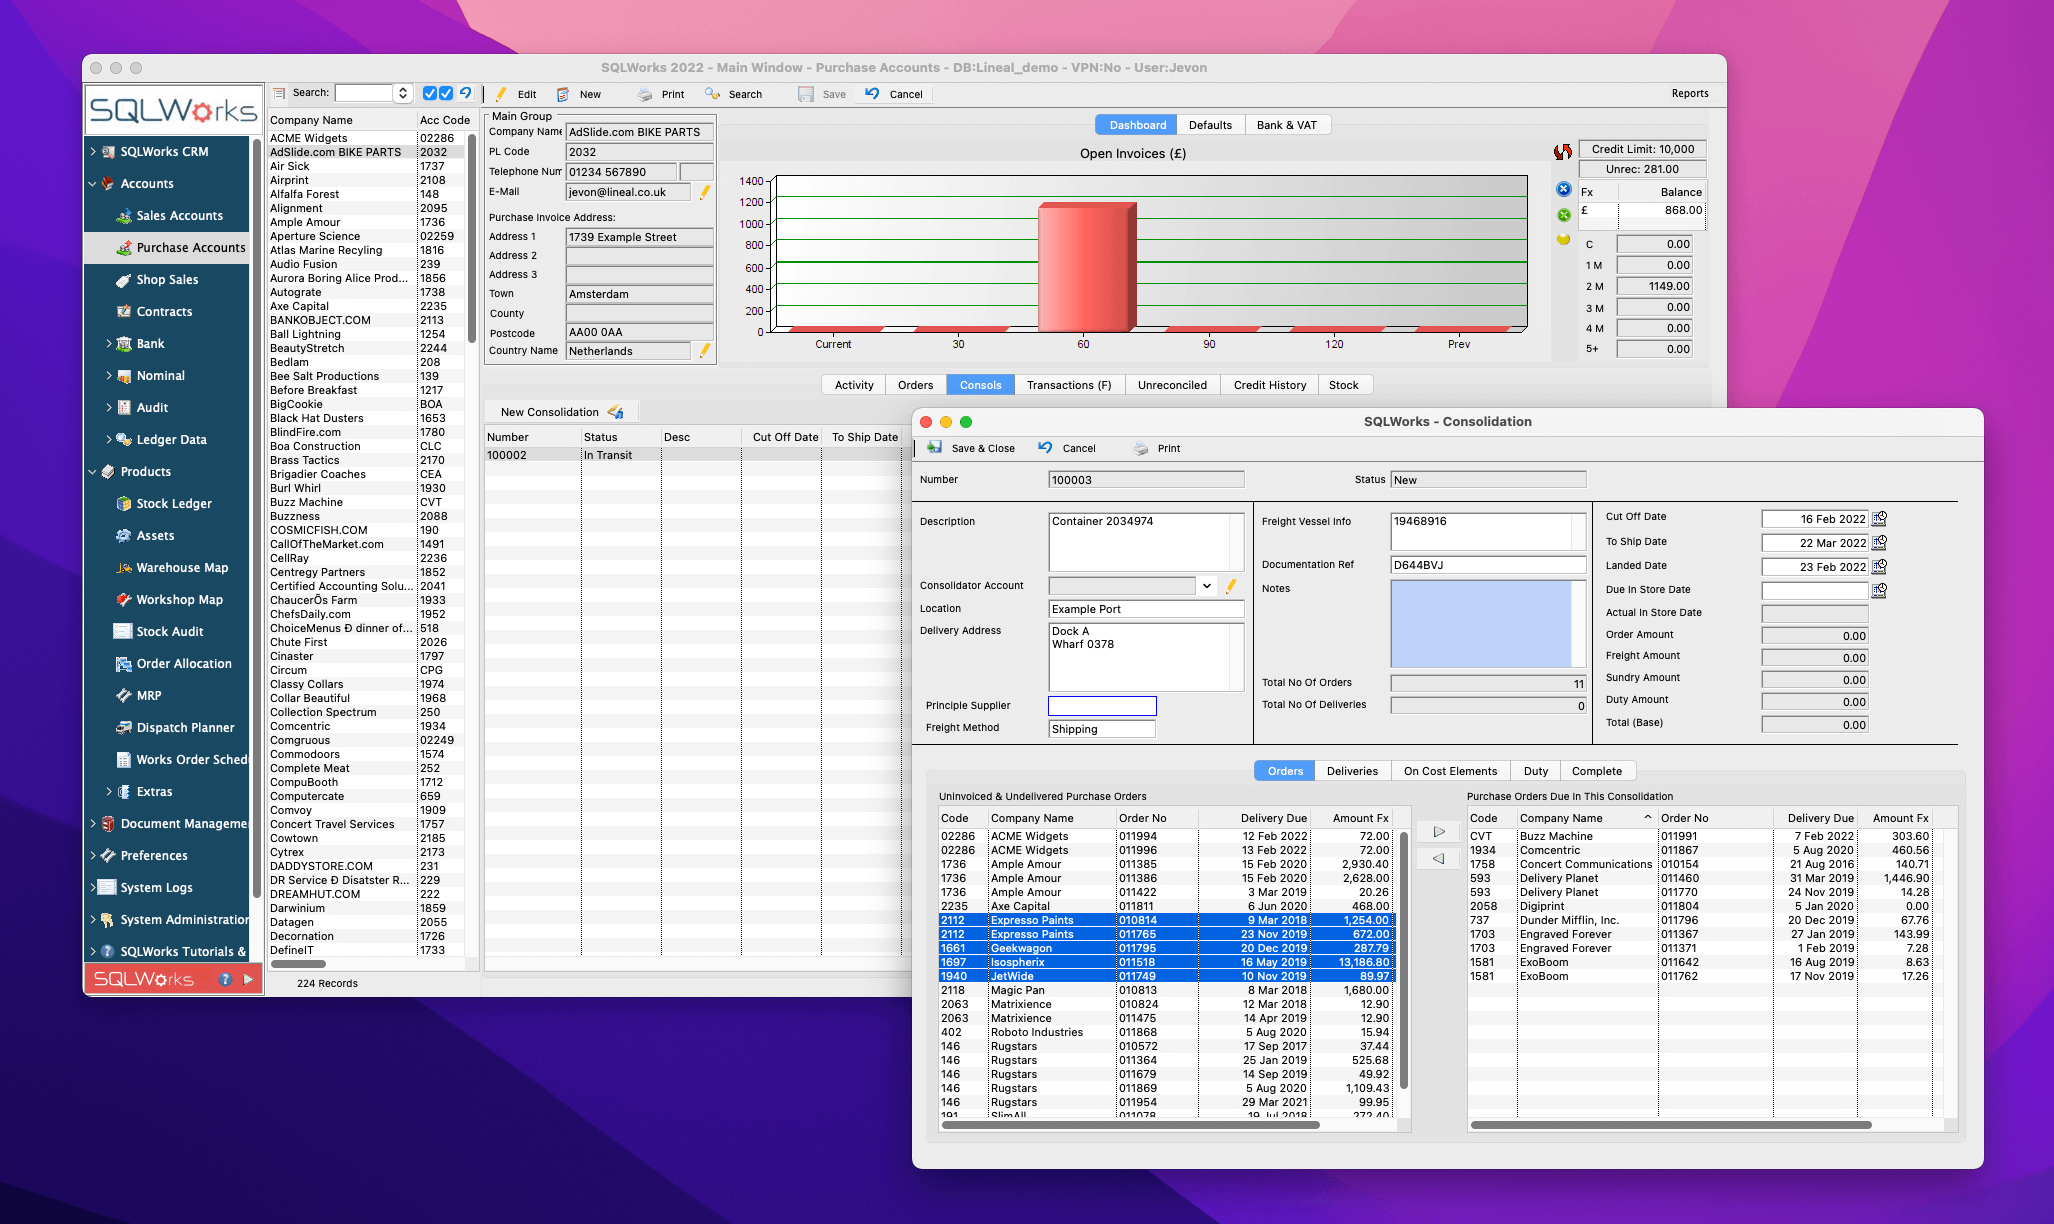
Here you can also manage other important information about that container, including actual delivery circumstances, additional on-costs or customs duty, and complete the shipping process.

On-costs can even be automatically split among the contents of that container, allowing a business to factor in the cost of shipping goods into those stock items’ cost-prices, sale-prices, and their eventual profitability.


Barcoding

SQLWorks permits stock-handlers to assign a barcode to any stock item, for use elsewhere in the platform. Intelligent Stock Ledger search fields allow the user to also search based on these bar codes, identifying a stock item even if only its bar code is known.

barcoding

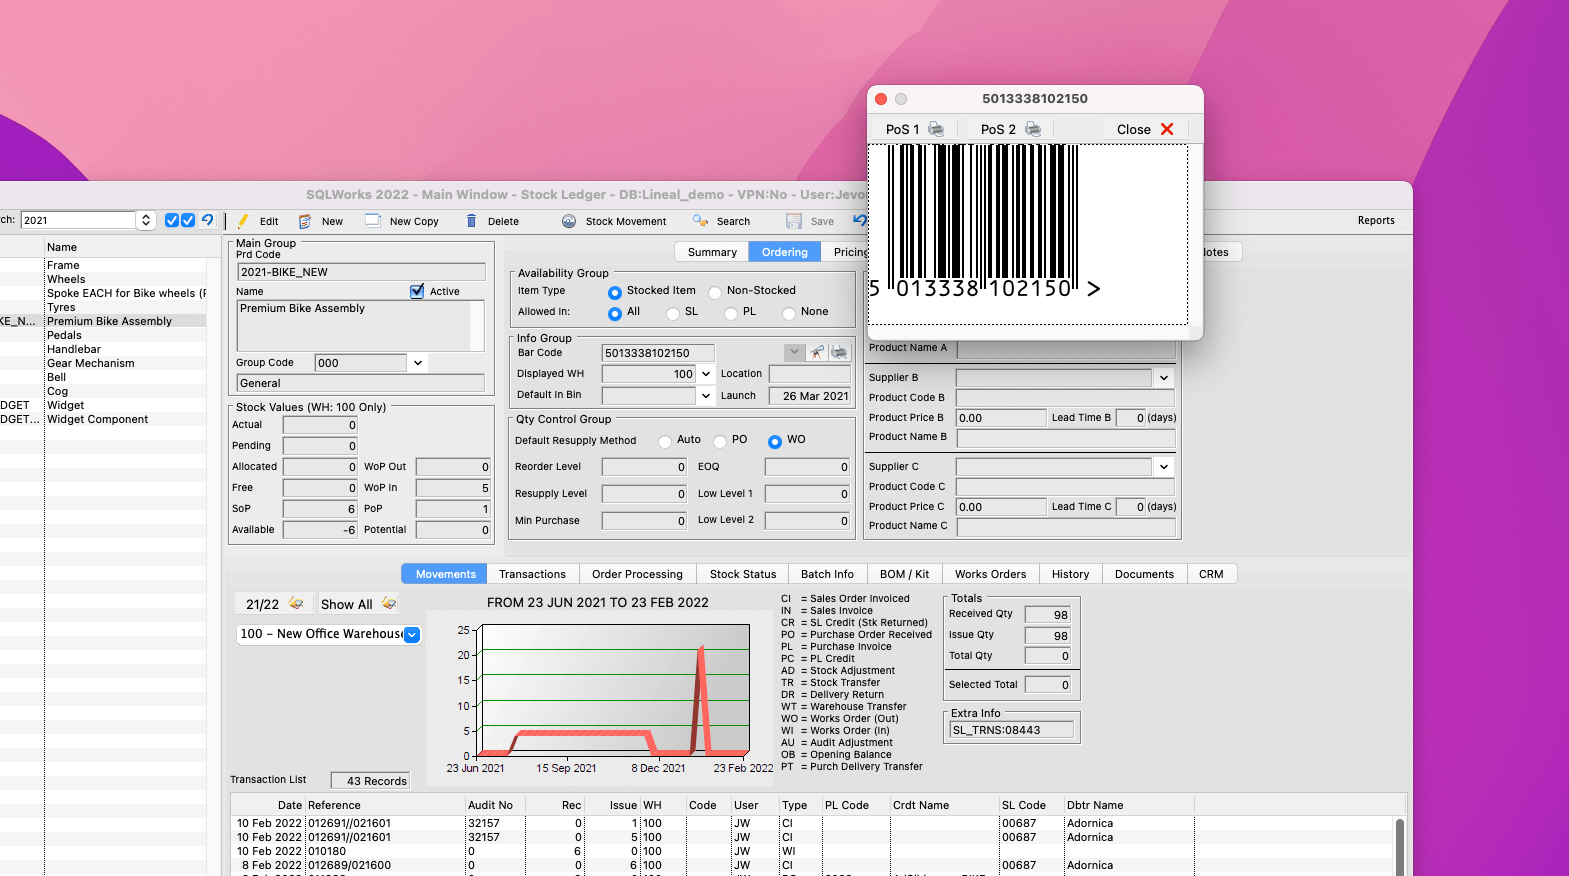
Besides each stock item’s ‘Bar Code’ field you can also generate a preview – this same technology can optionally be used on a company’s templates for orders, pick sheets, delivery notes and many others, to help speed-up stock identification wherever that paperwork needs to be used.

SQLWorks uses EAN13 barcode generation that is accurate, internationalised, and works with a wide range of 3rd-party barcode scanning devices.


Dangerous Goods & Tariff Codes

With the need to declare tariff codes for internationally shipped goods, and dangerous goods codes for anything hazardous, these can be assigned to any stock item in SQLWorks under the ‘Advanced’ Tab.

tariff codes

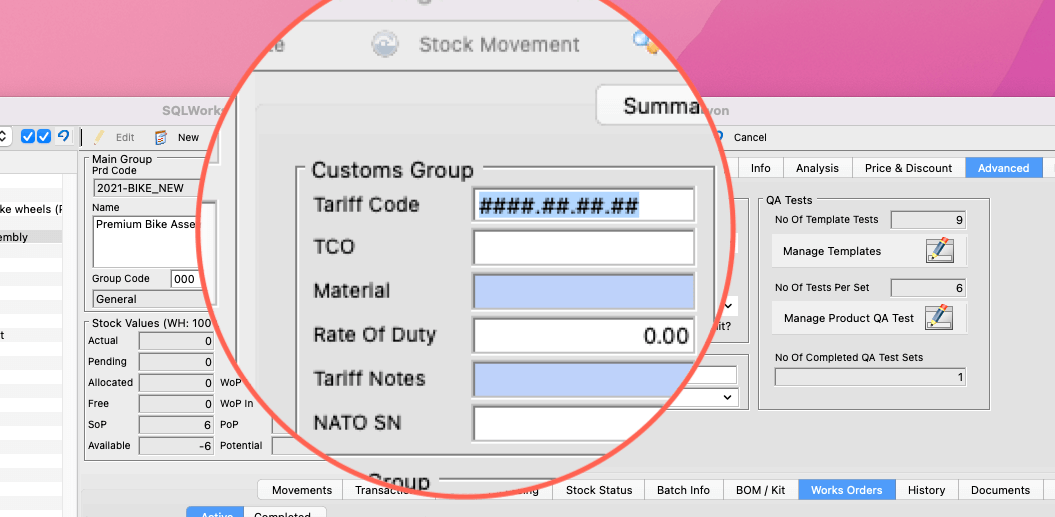
We use formats from the UK Department for International Trade’s published 2021 dataset as our starting point.

Much like pricing or descriptions, shipping codes can be merged wherever stock items appear on documentation – please discuss with the SQLWorks team if your business has any special requirements.


Please speak to the SQLWorks Team to learn how our software can transform business operations. Contact us.

Getting Started with Query Builder

Query Builder:

Query builder is a powerful reporting tool that advanced users can use to interrogate the SQLWorks database, cross-reference data in new ways, and get insight from business analytics.

Working in steps across the screen, Query Builder guides the user across four main tabs including ‘Setup’, ‘Tables’, ‘Conditions’ and ‘Preview.’

Setup tab allows users to create new queries, and choose the base layer data for their query from their SQLWorks database. For convenience, users can save queries here, opt whether to share them with other users, and re-run their favourites to generate new results as system data is updated.

In the Tables tab, the user can drag in related tables to cross reference different data within the database, and build new comparative reports that don’t already exist by default by selecting one or more data columns from within those tables.

query builder gif

The Conditions tab is perhaps the most powerful – allowing the user to assemble or subdivide the existing data in ways to extract very specific report outputs. Three tools are available here – Filter By, Sort By, and Group By. Filter By options can be used flexibly to exclude irrelevant data an target subsets, while Sort By allows you to re-order everything based on a specific table column to highlight priority data first.

Group By allows users to aggregate data in powerful ways – for example totally values per company, automatically calculating averages into value fields, or totalling costs. Programming criteria are available to do this, including ‘Distinct’, ‘Count’, ‘Concatenate’, ‘Maximum’, ‘Minimum’, ‘Sum’ and ‘Average’ – with columns ordered or re-designated to structure the report as you wish.

query builder group by

In the Preview tab, users can preview the results of their query and export to a range of formats including Excel spreadsheet (.xlsx), Comma-separated value (.csv), text (.txt), PDF (.pdf), print formats, or even email the results direct to themselves.

We hope users will find Query Builder to be a potent weapon in their arsenal of reporting tools – giving you new ways to identify patterns, compare and contrast relative data, or summarise from a new perspective.


For more information, please see our full guide to using query builder, or contact our team today.

Updated: Export to Excel

Export to Excel:

SQLWorks allows users to export data from almost any visible table (and most reports) to structured spreadsheet formats including Microsoft Excel (.XLSX) and comma-separated values (.CSV) – useful for manipulating data and analysing trends.

.CSV files are useful, but are basically limited to plain text organised with column breaks. Exporting to Excel provides much more scope for organising the output data for business purposes.

To make this more powerful, we’ve recently updated the options available when users export SQLWorks data to Excel to include:


1. Smarter Headers:

Column headers are delivered in a separate text format, with bold and underline – and now display numbered headers correctly. Where columns are clearly identifiable, Excel exports are also given column data formats (date / integer / text etc.) automatically.

spreadsheet


2. Automated Column widths

SQLWorks will scan the data being exported and size each Excel column appropriately for the data being exported.

This helps minimise the amount of spreadsheet formatting the user has to do manually. Automatic column sizing also factors in the column header, and works between 5-80 characters.


3. Intelligent Alignment

In line with accounting display conventions, ‘text’ data is left aligned by default, while ‘date’ and ‘number’ data is now automatically right aligned (as are headers.)

This helps make it easier to label numbers with text in the same row – and to compare various numbers in the same column, even if they share a preceding digit, but have different orders of magnitude.


Each user’s default export type is accessible via their CRM preferences – allowing users who require their data pre-formatted in Excel to choose this as their preferred output.

Data can be exported from reports by choosing ‘File’ as the export destination, or by highlighting some or all rows in any SQLWorks table and selecting ‘Export’. If Microsoft Excel is your default application for .XLSX and .CSV files, the app will open the data on screen automatically.


For more data management expertise and support, please contact our team today.