Getting Started with Query Builder
Query Builder:
Query builder is a powerful reporting tool that advanced users can use to interrogate the SQLWorks database, cross-reference data in new ways, and get insight from business analytics.
Working in steps across the screen, Query Builder guides the user across four main tabs including ‘Setup’, ‘Tables’, ‘Conditions’ and ‘Preview.’
Setup tab allows users to create new queries, and choose the base layer data for their query from their SQLWorks database. For convenience, users can save queries here, opt whether to share them with other users, and re-run their favourites to generate new results as system data is updated.
In the Tables tab, the user can drag in related tables to cross reference different data within the database, and build new comparative reports that don’t already exist by default by selecting one or more data columns from within those tables.
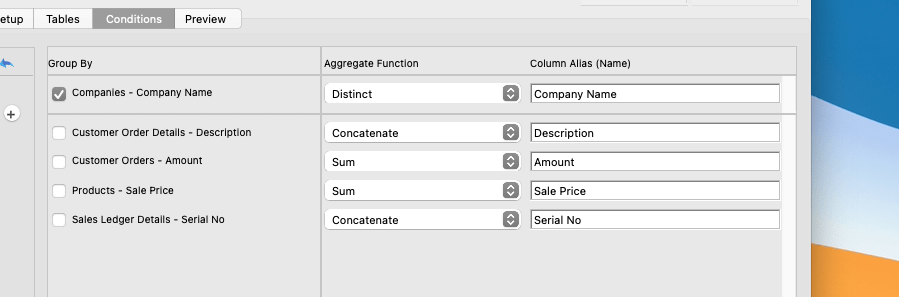
The Conditions tab is perhaps the most powerful – allowing the user to assemble or subdivide the existing data in ways to extract very specific report outputs. Three tools are available here – Filter By, Sort By, and Group By. Filter By options can be used flexibly to exclude irrelevant data an target subsets, while Sort By allows you to re-order everything based on a specific table column to highlight priority data first.
Group By allows users to aggregate data in powerful ways – for example totally values per company, automatically calculating averages into value fields, or totalling costs. Programming criteria are available to do this, including ‘Distinct’, ‘Count’, ‘Concatenate’, ‘Maximum’, ‘Minimum’, ‘Sum’ and ‘Average’ – with columns ordered or re-designated to structure the report as you wish.
In the Preview tab, users can preview the results of their query and export to a range of formats including Excel spreadsheet (.xlsx), Comma-separated value (.csv), text (.txt), PDF (.pdf), print formats, or even email the results direct to themselves.
We hope users will find Query Builder to be a potent weapon in their arsenal of reporting tools – giving you new ways to identify patterns, compare and contrast relative data, or summarise from a new perspective.
For more information, please see our full guide to using query builder, or contact our team today.